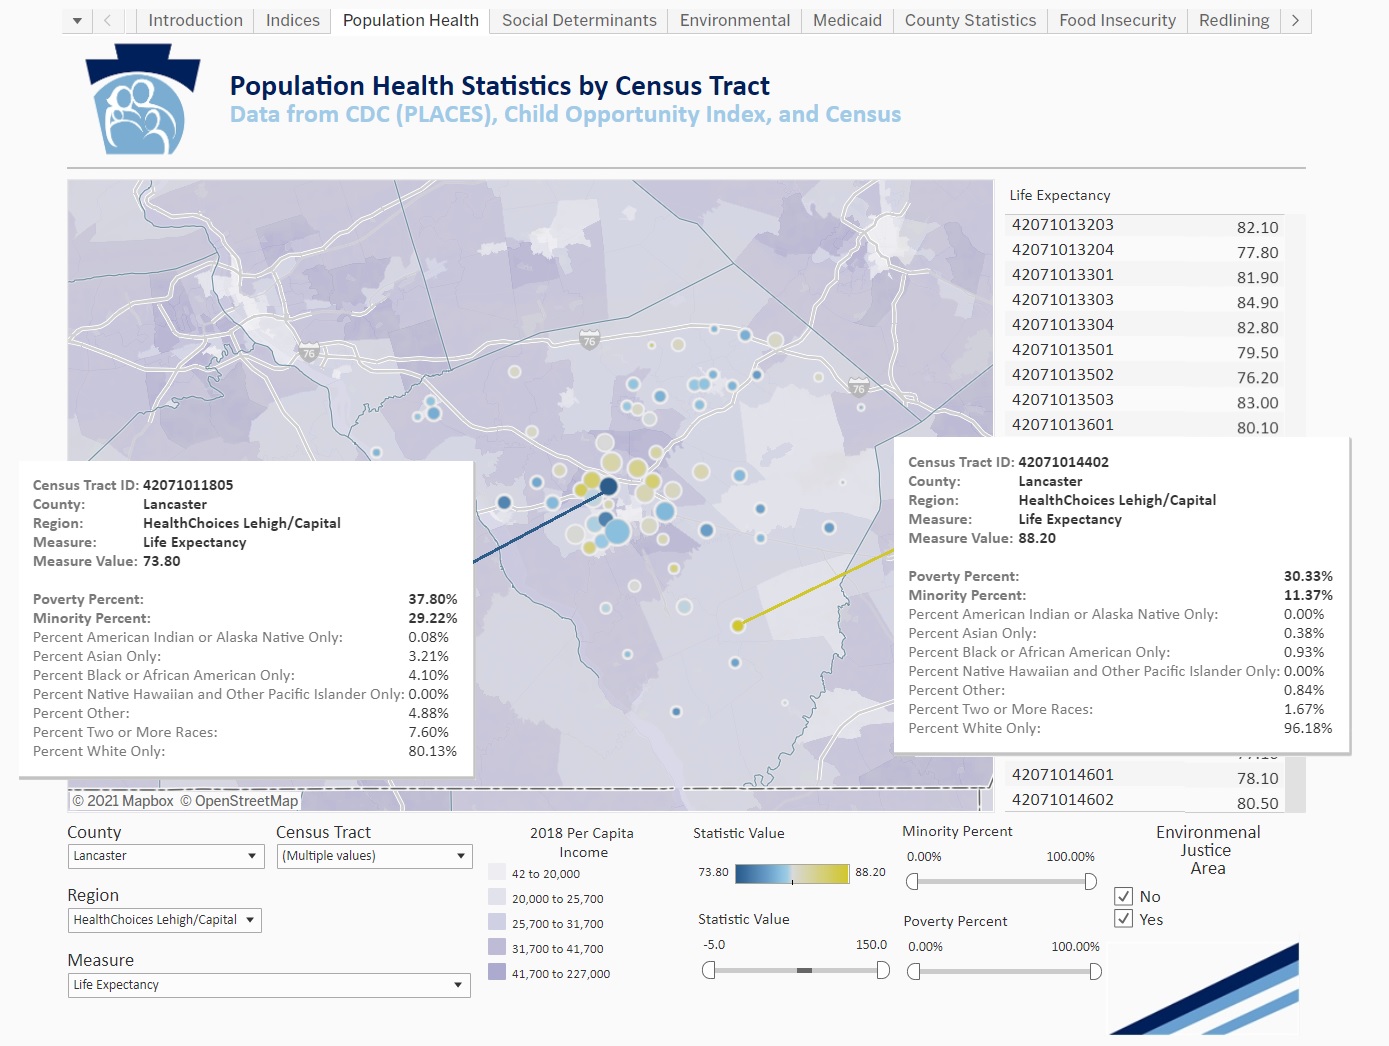
The Wolf administration on Wednesday unveiled an interactive mapping tool designed to help local stakeholders identify and remedy health disparities.
The PA Health Equity Analysis Tool, or PA HEAT map, provides a large array of health, economic and demographic data at the state, county, ZIP code and census tract level. Results can be filtered to show correlations between health indicators and various social and economic determinants of health.
The map "was created to help providers, partners and the public better understand opportunities to address population health across Pennsylvania," the departments of Health and Human Services said in a statement.


"By assessing social data, considering case rates, and mapping to Pennsylvania census tracts and zip codes by vulnerability, we can ensure that a higher percentage of people with these vulnerabilities are part of an equitable approach when considering complete health equity," acting Physician General Dr. Denise Johnson said.
Alisa Jones, president and CEO of Union Community Care, a federally qualified health center that serves Lancaster and Lebanon counties, likes what the HEAT map offers.
"HEAT is a robust tool that gives us more information than we’ve previously had on both population health and healthcare access measures," she said.

But data is only a starting point, she cautioned: "Addressing health disparities and making our communities more equitable is long-term work that requires individual actions, systems working together and policy changes."
'Whole-person' health care
PA HEAT is part of the "whole-person" health care initiative that the Wolf administration launched last fall, said Dr. Doug Jacobs, chief medical officer for the Department of Human Services.
"Health is more than personal decisions," he said: The environment individuals are born into have dramatic impacts on their life outcomes.
In Erie, average life expectancy can range from 62 to 83, depending on which neighborhood you're in — "a difference of 21 life years just minutes' walk away," Jacobs said.
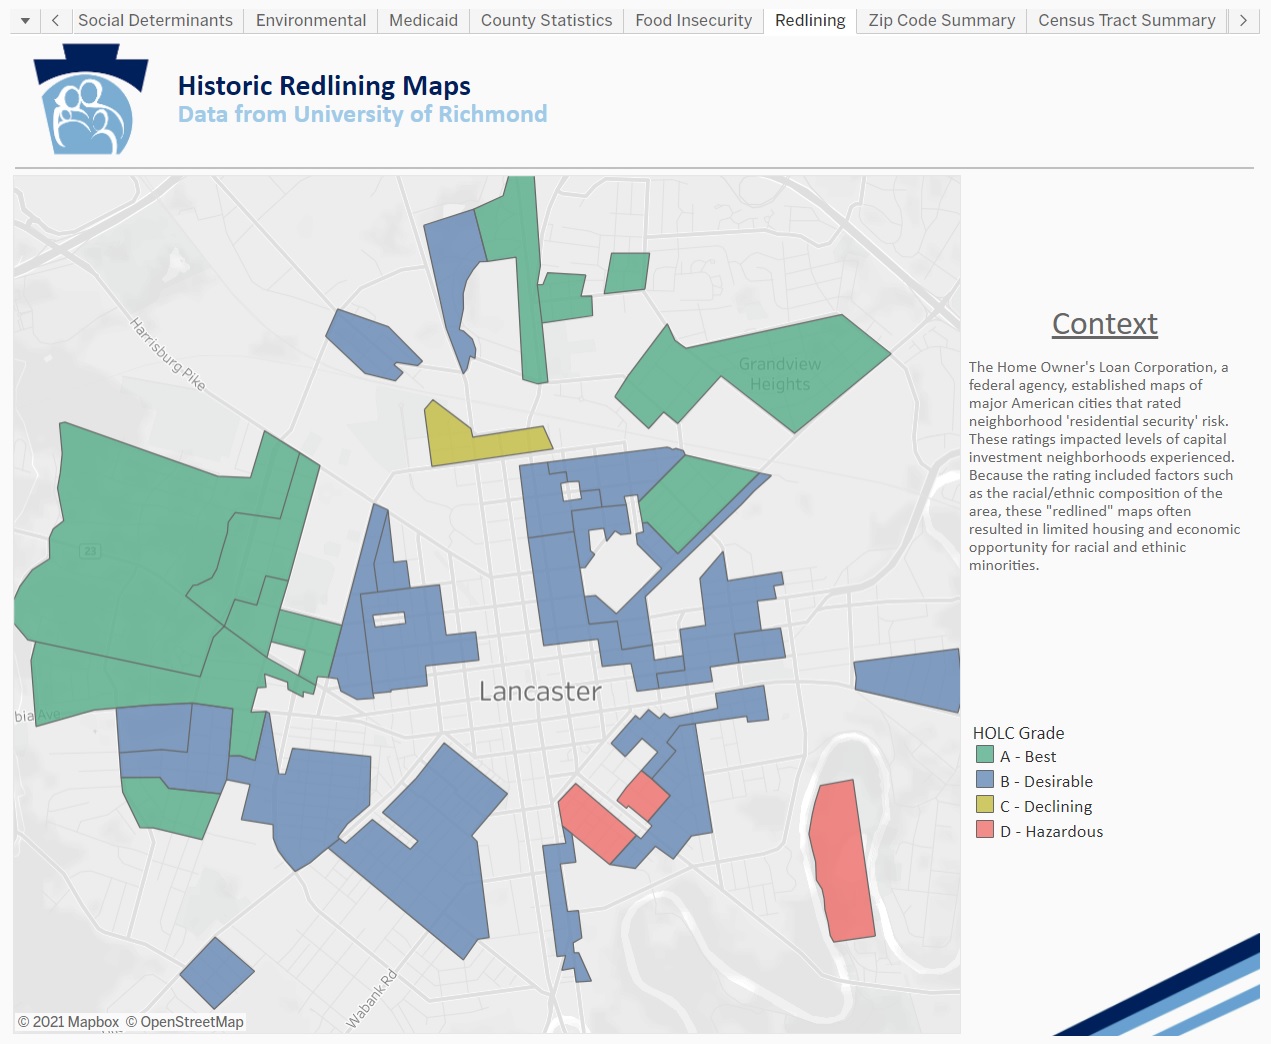
One dashboard shows historic redlining boundaries: The federal government designated certain areas as financial security risks in the mid-20th century, a practice that reduced investments there and limited financial opportunities for minorities.
Jacobs said he hopes the tool will "empower communities ... to arm them with their own data to better understand the health inequities that exist."
A user guide and several video tutorials are available on the PA HEAT home page. The state plans to keep the data current, updating it every year or so, Jacobs said.


