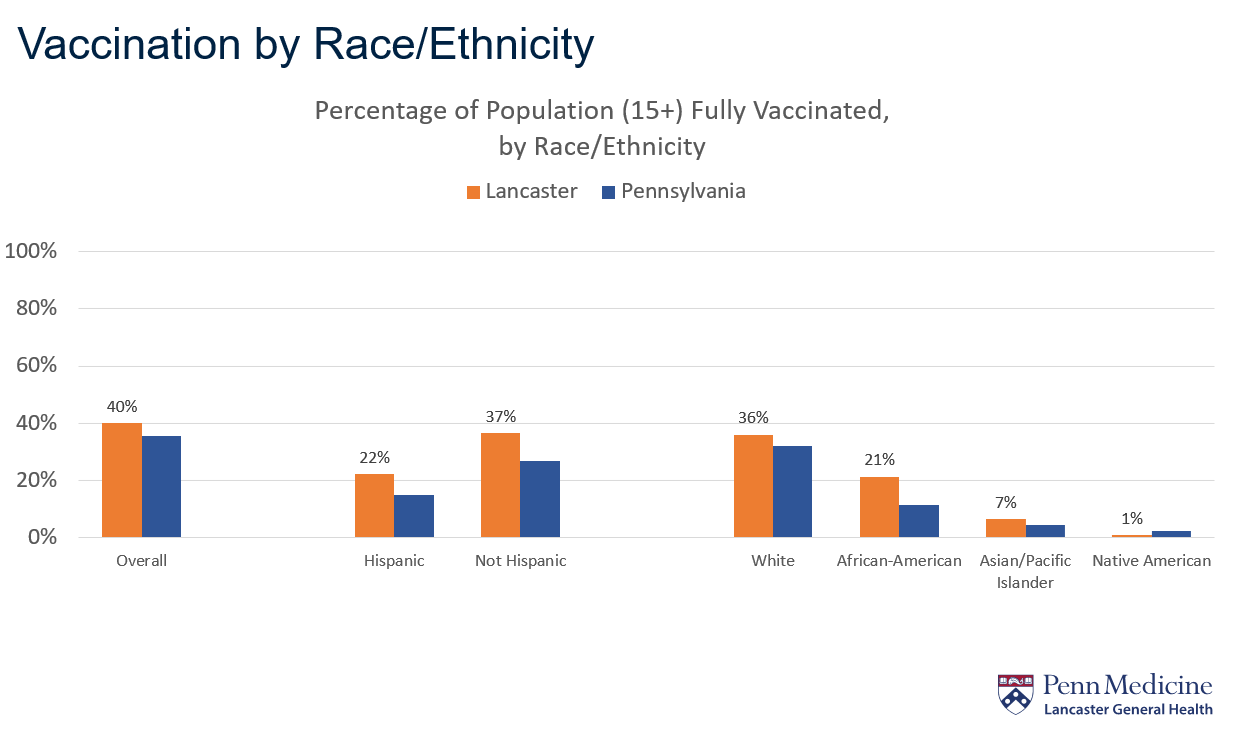
According to state data, 40% of Lancaster County residents age 15 and up are fully vaccinated. Yet the state's rate for each demographic subgroup is lower.
If the data were complete, that would be a mathematical impossibility. However, the state lacks demographic data for 11.7% of Lancaster County's vaccinated population, or more than 20,000 individuals.
That's part of the reason the percentages don't add up, Brenda Buescher, health promotion specialist for Penn Medicine Lancaster General Health, said in an email.
"Also, people may be categorized as more than one race, but those numbers may be challenging to calculate accurate population percentages," Buescher said, "so they are left out of the group percentages but included overall."
Buescher presented the data on Friday during the United Way of Lancaster County's online forum on vaccine equity.
Twenty thousand people with unknown demographics is a lot: It's comparable to the size of Lancaster County's adult Black population and about If most of them were from minority groups, then those groups' actual vaccination rates could be much higher than reported. Buescher, however, said that's probably not the case.
"Based on national data, and the United Way/F&M survey done last fall, we know that certain racial groups were more vaccine hesitant, so it seems likely that there is still a true disparity in the vaccine uptake rates," she said.
One United Lancaster also asked Buescher about the unusually low reported vaccination rates for Asian/Pacific Islanders and Native Americans: 7% and 1%, respectively.
The statewide rates are similar, and they're indeed puzzling, Buescher said.
"It is possible there’s an issue with that data," she said. "Our team is trying to validate it with real-world experience."
The Department of Health, which collects and publishes the vaccine data, did not immediately respond Friday to a request for comment.


