As Lancaster voters vote and eagerly await results from the primary election, a question on most Democrats’ minds is “will this be the year Lancaster goes blue?” In a recent LNP story, Carter Walker reviewed election trends over the last 20 years and asked the same question. Yes, the county has been trending purple, but there is still a long way to go before Lancaster can be a consistent swing county. Building on Mr. Walker’s reporting, I analyzed voter registration data on a precinct level, election results to calculate partisan voter index, and US Census data on key demographics that recently leaned left.
Let’s start with the fundamentals. As of June 1, 2020, Democrats are still at a voter registration deficit holding 33.1% of the county electorate versus the Republicans at 50.9%. That is a gap of 58,891 voters.1
In 2018, when there was more Democratic enthusiasm both nationwide and in the Commonwealth, Democrats running for US Senate and the US House of Representatives still came up short in Lancaster. Senator Bob Casey lost 44.7% to 53.1% county-wide. Jess King lost 43.9% to 56.0%.2 The blue wave that crested over the places like Orange County, California and the Philly suburbs didn’t quite crest over Lancaster County.
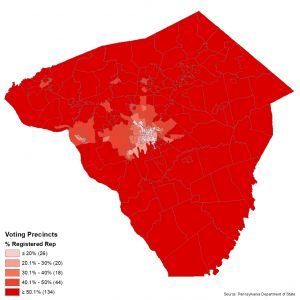
Drilling down further, Democrats are at a disadvantage on a precinct-by-precinct level. Democrats hold a registration majority in 48 precincts while the Republicans hold a majority in an overwhelming 134 precincts.
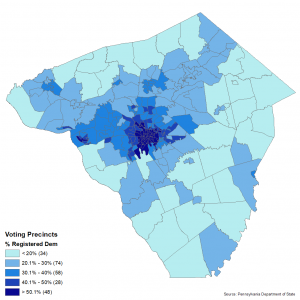
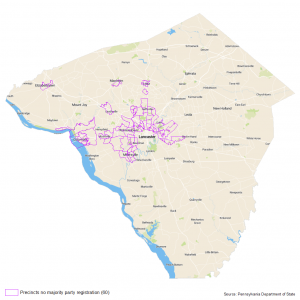
This leaves 60 precincts where neither party has a registration advantage.3 These precincts are in the areas to the immediate north, west, and east of Lancaster City as well as Columbia, Elizabethtown, Landisville, Lititz, and Manheim. Of course, not all precincts have the same number of voters but building a strong localized base of voters creates more opportunities to win down-ballot races like township commissioner, school board, or borough council. Having more Democrats in these offices builds a bench of candidates for potential higher office - a pipeline.
Voter registration is just one factor. Districts and seats flip. A well organized campaign and party can overcome voter registration deficits, so let’s take a look at election performance.
A popular political metric to gauge relative partisan performance is the Cook Partisan Voter Index (PVI). It measures a district’s or state’s lean towards the Democratic or Republican Party compared to the nation as a whole.4 To calculate the PVI score for a district, the election results of the last two US Presidential cycles are averaged and compared to the US Presidential election result average.
For example, take House District 43, which comprises most of the Conestoga Valley School District. In 2016 and 2012, the Republican won the district 67.0-33.0 and 64.3-35.7 respectively, which averages to 65.7-34.4. The US Presidential popular vote results for 2016 and 2012 were 48.2-46.1 and 51.1-47.2 favoring the Democrats, which averages to 49.7-46.7. Comparing HD-43’s results to the US Presidential results shows that the Republican win in HD-43 out performed the Republican national average by 19 points (65.7 - 46.7 = 19). The PVI therefore is R+19.
Here are the PVIs for eight of the county’s House Districts. House Districts 13, 128, and 129 are not included because these districts did not include portions of the county in 2012.
| House District | PVI |
| 37 | R+26 |
| 41 | R+14 |
| 43 | R+19 |
| 96 | D+21 |
| 97* | R+16 |
| 98** | R+18 |
| 99* | R+28 |
| 100* | R+27 |
*These HDs were uncontested in 2012. Only the 2016 results were used to calculate the PVI.
**HD-98 was uncontested in both the 2016 and 2012 elections. Results from the 2018 election were used to calculate the PVI.
To contextualize these PVIs, US Congressional District 11, Representative Lloyd Smucker’s seat, has a PVI of R+14. HD-96 which includes Lancaster City has the same score as the Congressional District encompassing Sacramento, California. HD-97 which includes areas Neffsville and Lititz has the same PVI as the state of North Dakota, which, to be fair, elected Democrat Heidi Heitkamp to the US Senate in 2012. For Democrats to win these districts, they need to outperform the Republican national average by 14-28 points.
Based on this data, voter registration and recent election results still favor the Republicans in Lancaster County. The LNP article highlighted excitement from the Democrats from feeling more competitive than in years past and also discusses demographics as factors that drive Democratic performance.
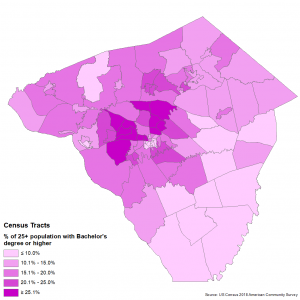
One demographic attribute that has been frequently cited as a driver for the 2018 Blue Wave is educational attainment. In a 2018 national exit poll conducted by CNN, voters with a bachelor’s or advanced degree voted Democrat in a US House of Representatives election.5 In Lancaster, the higher portions of the population aged 25+ who have at least a bachelor’s degree are found in the northern and western suburbs of Lancaster City in the Manheim Township, Hempfield, and Penn Manor school districts. This can partly explain the success Democrats in Manheim Township saw in the school board and township commission elections.
While demographic changes are favorable tailwinds for the Lancaster County Democrats, structural weaknesses still pose a challenge for consistent Democratic wins in the county. In order for Lancaster County to become a swing county, the Democrats must continue to invest in voter registration and voter turnout operations. Demographics shifts alone can’t save a party.